Note: E-Commerce reports require the Pro version of the “HT Easy Ga4” and “WooCommerce” plugins activated.

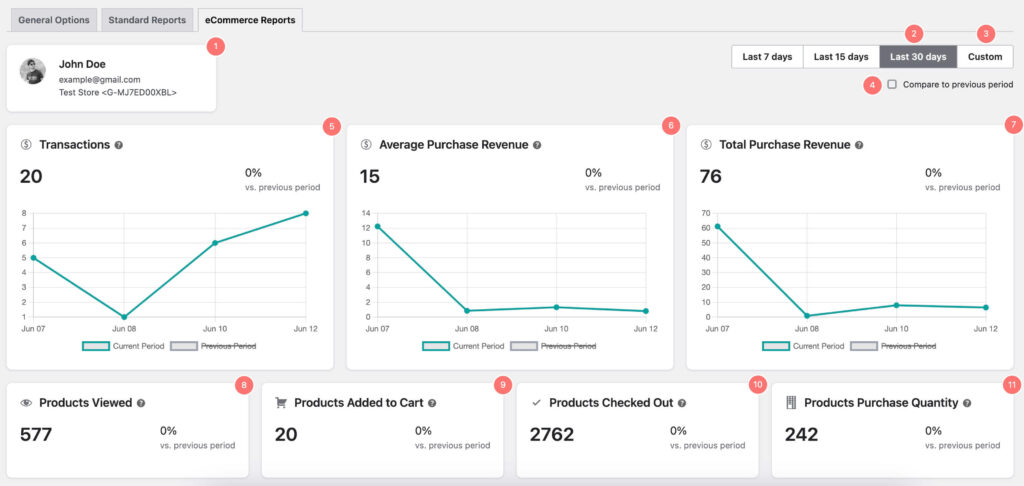
1. This section shows you which email account you are logged into and which measurement ID the report is for.
2. The report shows data for the last 30 days by default.
3. You can choose a custom date range to see data for a different period of time.
4. You can compare the report with previous data to see how your website has performed over time.
5. Transactions: A transaction is a sale that is made on your website. Transactions can be used to track how many sales you have made and to identify trends in sales.
6. Average purchase revenue: The average purchase revenue report shows you the average amount of money that each user spends when they make a purchase on your website. This report can be used to identify which products are most profitable and to make changes to your marketing campaigns to drive more sales of these products.
7. Total purchase revenue: The total purchase revenue report shows you the total amount of money that has been spent on your website. This report can be used to track the performance of your website over time and to identify trends in revenue.
8. Product viewed: The product viewed report shows you the number of times each product on your website has been viewed. This report can be used to identify popular products and to promote these products to users.
9. Products added to cart: The products added to cart report shows you the number of times each product on your website has been added to a cart. This report can be used to identify popular products and to make changes to your website to increase the number of products that are added to carts.
10. Products checked out: The products checked out report shows you the number of times each product on your website has been purchased. This report can be used to identify popular products and to make changes to your website to increase the number of products that are purchased.
11. Product purchase quantity: The product purchase quantity report shows you the number of units of each product that have been purchased. This report can be used to identify popular products and to make changes to your inventory to ensure that you have enough of these products in stock.
12. Top products: The top products report shows you the products on your website that have been sold the most. This report can be used to identify popular products and to promote these products to users.
13. Top referrers: The top referrers report shows you the websites that have sent the most traffic to your site that has resulted in a purchase. This report can be used to identify where your traffic is coming from and to make changes to your marketing campaigns to drive more traffic from these sources.


