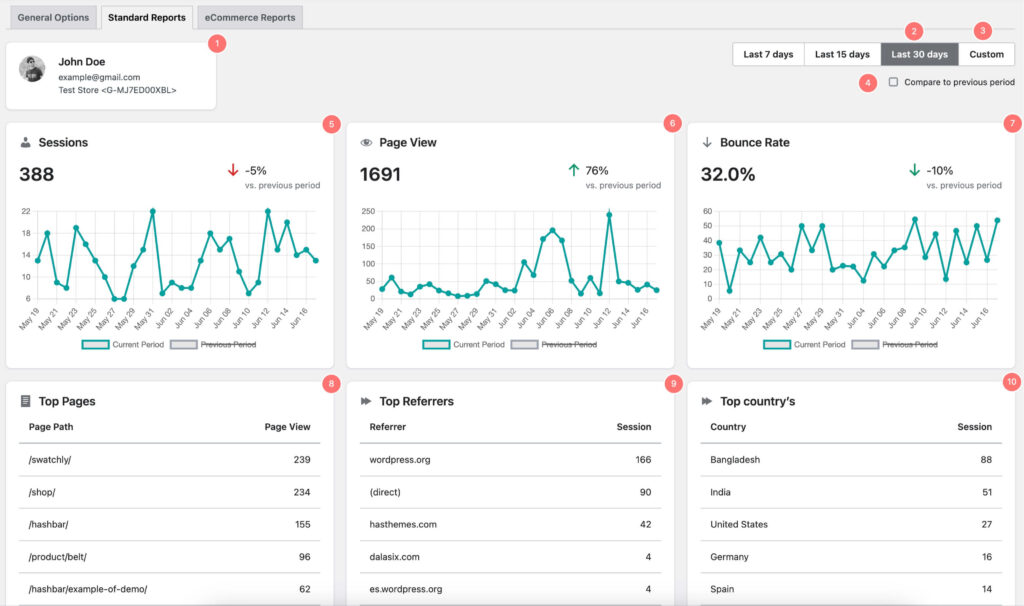
1. This section shows you which email account you are logged into and which measurement ID the report is for.
2. The report shows data for the last 30 days by default.
3. You can choose a custom date range to see data for a different period of time.
4. You can compare the report with previous data to see how your website has performed over time.
5. Sessions: A session is a group of interactions that a user has with your website within a certain period of time. Sessions can be used to track how users are using your website and to identify trends in user behavior.
6. Page views: A page view is a count of the number of times a page on your website has been loaded. Page views can be used to track how popular your pages are and to identify which pages are driving the most traffic to your site.
7. Bounce rate: Bounce rate is the percentage of users who leave your website after viewing only one page. Bounce rate can be used to identify pages that are not engaging users and to make changes to improve the user experience.
7. Top pages: The top pages report shows you the pages on your website that have been viewed the most. This report can be used to identify popular content and to promote these pages to users.
8. Top referrers: The top referrers report shows you the websites that have sent the most traffic to your site. This report can be used to identify where your traffic is coming from and to make changes to your marketing campaigns to drive more traffic from these sources.
9. Top countries: The top countries report shows you the countries from which your users are coming. This report can be used to identify where your audience is located and to make changes to your website and marketing campaigns to appeal to these users.
10. User types: The user types report shows you the different types of users who are visiting your website. This report can be used to identify different segments of your audience and to make changes to your website and marketing campaigns to appeal to these segments.
10. Device types: The device types report shows you the different types of devices that are being used to access your website. This report can be used to identify which devices your audience is using and to make changes to your website to improve the user experience on these devices.


